A cumulative sum is a way of calculating how a number grows over time. A use case of this is to show how well your company performs based on the distribution metrics, the difference between previous and current values, et cetera. For example, if you want to monitor if the free shipping has an impact on the sales performance between the current point in time A-to-B and compare it to the previous sales without the free shipping offering. This can be a big advantage in helping you execute the right strategic decision based on the results. However, in real-life situations, data grows over time, and doing this manually by hand is very time-consuming as you may have to split different ranges of your data during calculations.
Although we can see the downside, we can calculate this easily using statistical software or even just from an excel spreadsheet. But first, let’s understand the concept of the cumulative sum equation in detecting increased change.
\(S_t=max\{0,S_{t-1} + (X_t-{\mu}-C)\} \)Equation Breakdown
Xt = is the sales at the current time (Current value on that day)
µ = is the mean average of the range e.g data points from 1-9
St = the difference from current data (Xt) – Average (µ) + the previous St
C = the critical value that controls the offset (sensitivity) of the detection
As mentioned, the C value is to control how aggressively you want to detect any increase based on the threshold settings. The threshold T is just a value limit against St to indicate if there is an increase happening e.g sales.
Sample Data Table
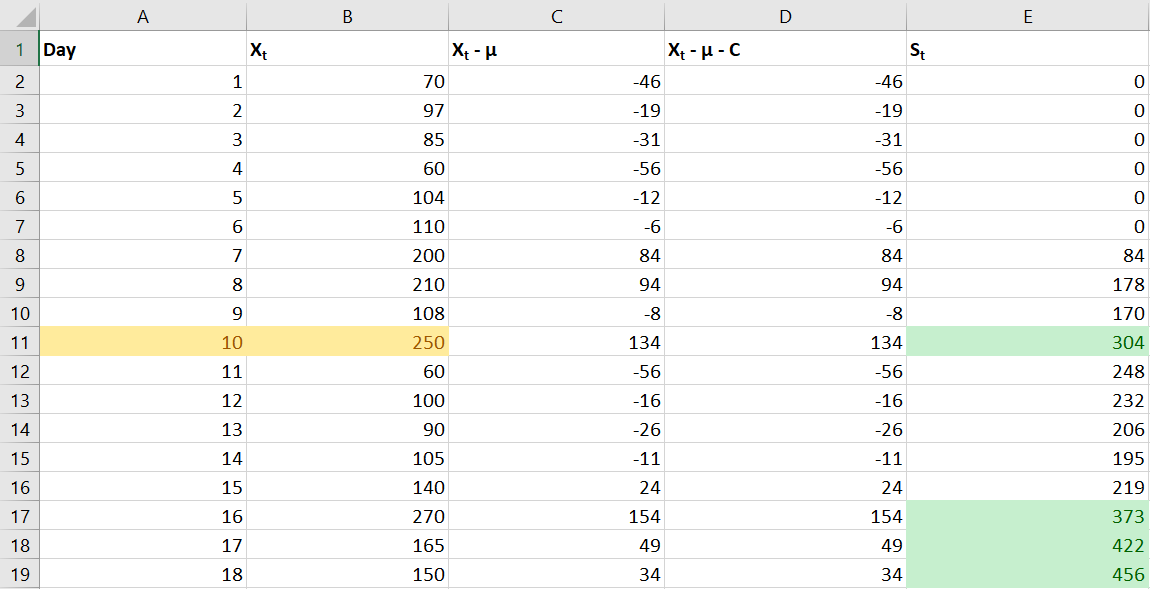
Supposed a company wants to strategize product delivery or offering. That said, the company set a Target value (goal) and wants to see if such a strategy increases sales performance. In this scenario, we can use the cumulative sum of different days (running total). Let Xt = Sales of the day, 1-9 is the range we want to calculate to determine the St of the highlighted in yellow. The mean or average of 1-9 rows from the Xt column is 116, and the critical value chosen is 0 to control its sensitivity. Note that the lower the C the fastest the St to get large, and the larger the harder. So in this example, 0 is viable as we want to detect a sales increase as soon as possible.
So if we plugin these number to get the St for the row 11 we will get \(S_t=170 + (250-116-0)\ \). Now, since the chosen threshold(T) from this example is 300 and if you do the math for the row number 9, its St = 304 and it is greater than 300. As a result, our model detect an increase in sales.
Note. Of course, C and T values all depend on the situation as you do not want to falsely make a conclusion too early in a critical situation such as detecting blood sugar or blood pressure changes or alerting everyone in lockdown due to COVID rate, et cetera.
Also, do not be confused if some of the St is set 0, this is because we only concerns of detecting increase changes. This means that if St < 0 , it is no longer relevant to the calculation so it reset to 0. Now, you may be wondering if there is a way to detect decrease, the answer is yes, and all you have to do is to switch the Xt and µ in the equation.
\(S_t=max\{0,S_{t-1} + ({\mu}-X_t-C)\} \)Conclusion
In this post, the basic concept of the cumulative sum (CUSUM) has been tackled which should give you a good foundation of how it works based on the use case provided. Also, we familiarize the equation and break down the different parameters, and reflect it in the table example. As a caveat, in critical situation, you should know how to balance the tradeoffs between critical value and threshold and analyze what it means against the baseline to make decisions.