
A simple linear regression model consists of one predictor variable and one dependent variable. The regression model formula is
\( \hat{Y} \) = intercept + slope ⋅ xor if you would think in math \(\hat{Y} = b_{0} + b_{1}x \)
Do not be confused with the equation or the formula. The y-hat (\( \hat{y} \)) is a predicted response variable from the predictor variable or x. The b0 is the intercept (value of y when x is zero). And the b1 is the slope or the rise over run in which a unit change in y based upon a unit change in x and these are referred to as regression coefficients.
Let’s consider the following dataset for the monthly E-commerce sales (in $1000’s) and online advertising costs (in $1000’s).
| Store | Monthly E-commerce Sales (in $1000) | Online Advertising Cost (in $1000) |
|---|---|---|
| 1 | 370 | 2.3 |
| 2 | 311 | 1.7 |
| 3 | 620 | 3.0 |
| 4 | 910 | 5 |
| 5 | 500 | 2.9 |
| 6 | 520 | 2.5 |
| 7 | 600 | 3.4 |
| 8 | 830 | 4.3 |
So if we execute the code
Sales<-c(370, 311, 620, 910, 500, 520, 600, 830)
Advertising.Cost<-c(2.3, 1.7, 3.0, 5, 2.9, 2.5, 3.4, 4.3)
plot(Advertising.Cost, Sales, xlab="Advertising Cost (in $1000)", ylab="Monthly E-commerce Sales (in $1000)", ylim=c(200,1000), pch=16, cex=2, col="blue")
abline(lm(Sales~Advertising.Cost))
As you would expect, the scatter plot below seems to just have linear data points that indicate and show a strong positive correlation. This makes sense and appropriate to use a simple linear regression model for the dataset.

It is so clear that when advertising costs go up it seems to carry the monthly E-commerce sales up as well. The orange linear regression line is what produce from the equation of a simple linear regression model.
By using R
mod<-lm(Sales~Advertising.Cost)
summary(mod)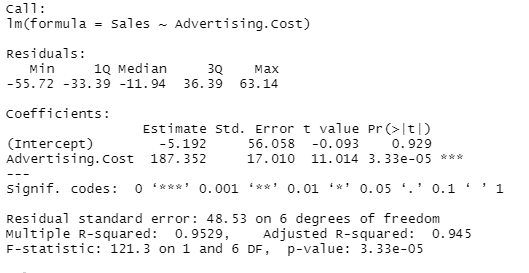
The estimate simple linear regression equation is
\( \hat{y} \)=-5.192 + 187.352x
3.33e-05 is the p-value which basically means that indicates that the advertising cost significantly affects the monthly E-commerce sales.
References
Minitlab (Jul 1, 2013). How to Interpret Regression Analysis Results: P-values and Coefficients. Retrieved from https://blog.minitab.com/blog/adventures-in-statistics-2/how-to-interpret-regression-analysis-results-p-values-and-coefficients#
Dr. Nic’s Maths and Stats(Feb 1, 2020). Understanding where the p-value comes from Retrieved from https://www.youtube.com/watch?v=0-fEKHSeRR0
Brandon Foltz (Nov 23,2013). Linear Regression, The Very Basic. Retrieved from https://youtu.be/ZkjP5RJLQF4?list=PLIeGtxpvyG-LoKUpV0fSY8BGKIMIdmfCi&t=218
Want to refresh it?
Linear Regression Part I
Linear Regression Part II